Mark David Barranda
________________________________
Data Science | Geospatial Information System and Technology
University of California, Berkeley '25


________________________________
Data Science | Geospatial Information System and Technology
University of California, Berkeley '25
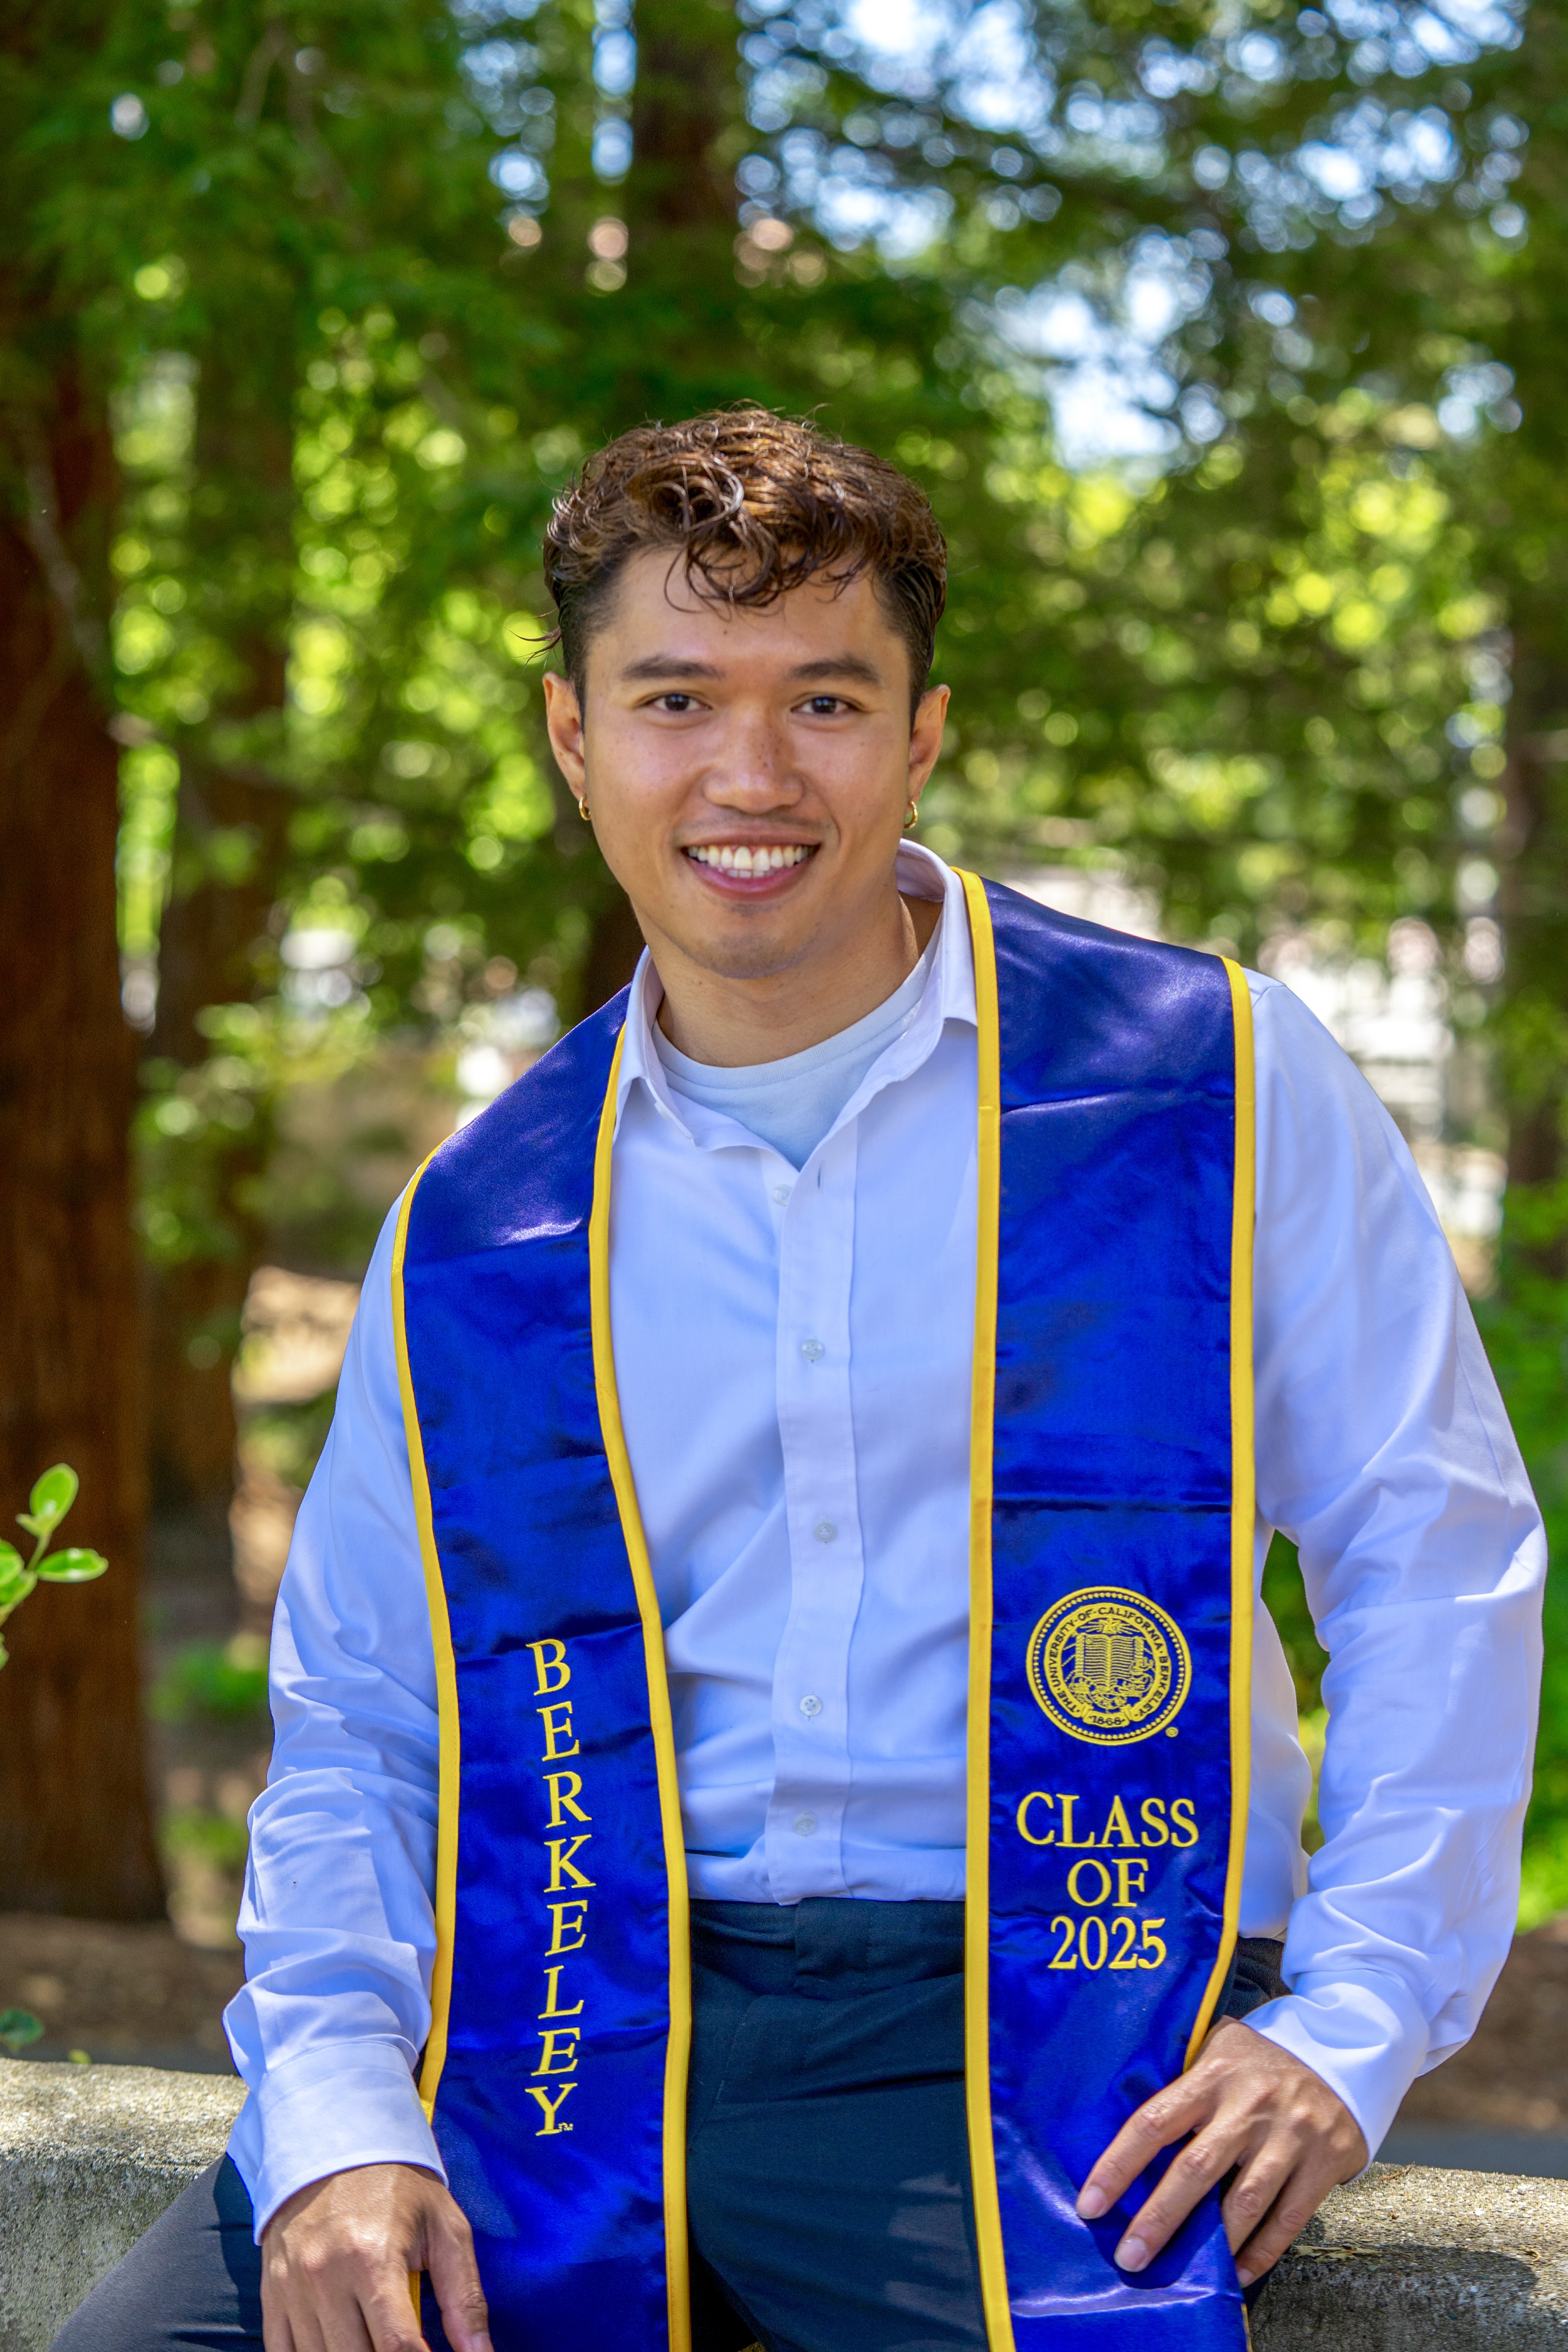
Hi, I'm Mark. I recently obtained my Bachelor's degree in Data Science with a focus on Geospatial Information and Technology from University of California, Berkeley.
Post undergrad, my goal is to continue growing my expertise in data science and applications of geospatial software and technologies through projects, career opportunities, and networking events. In my spare time, I like to travel, play volleyball, visit coffee shops, and cook. Name a dish, and I'll learn it!

Obtained a Bachelor's in Data Science with emphasis on Geospatial Information and Tech
Built three interactive Jupyter Notebooks (Statistics, Sociology, Ethnic Studies) to expand Data Science outreach to El Camino College students
Conducted scholarly research and provided python scripting support for the early stage development of a gridded air temperature database for Urban Heat Island Studies
Served as the Director of Non Profit Consulting for UC Berkeley's Data Science Society where I oversaw 4 project managers and 12 consultants in partnership with nonprofits such as MongaBay and School on Wheels.
Created an AI powered tool to assess adherence of journalist articles to TEMPOS Framework for Stanford Medicine
Built financial forecasting models using ARIMA and LSTMs at Universal Health Services
Predicted streamflows across California using USGS historical gage data.
Created a GIS & AI powered dashboard to visualize World Wildlife Fund's global accomplishments
Began studies at UC Berkeley

Obtained Associates w/ High Honors
President's and Dean's List
Phi Theta Kappa
Lead Production Consultant
All
GIS Analysis & Remote Sensing
Data Science Consulting Experience

Developed an interactive Streamlit app in partnership with Stanford Medicine and the County of Santa Clara to evaluate media content using the TEMPOS Framework—a tool designed to assess how closely news articles align with best practices for reporting on suicide. The app allows users to input text and receive real-time feedback powered by large language models, streamlining the evaluation process for healthcare professionals, public health communicators, and media researchers.
By combining natural language processing with an intuitive user interface, the tool makes a typically nuanced and manual process more efficient, consistent, and scalable. Its ultimate goal is to support responsible media reporting and reduce the risk of suicide contagion by promoting adherence to evidence-based communication standards.
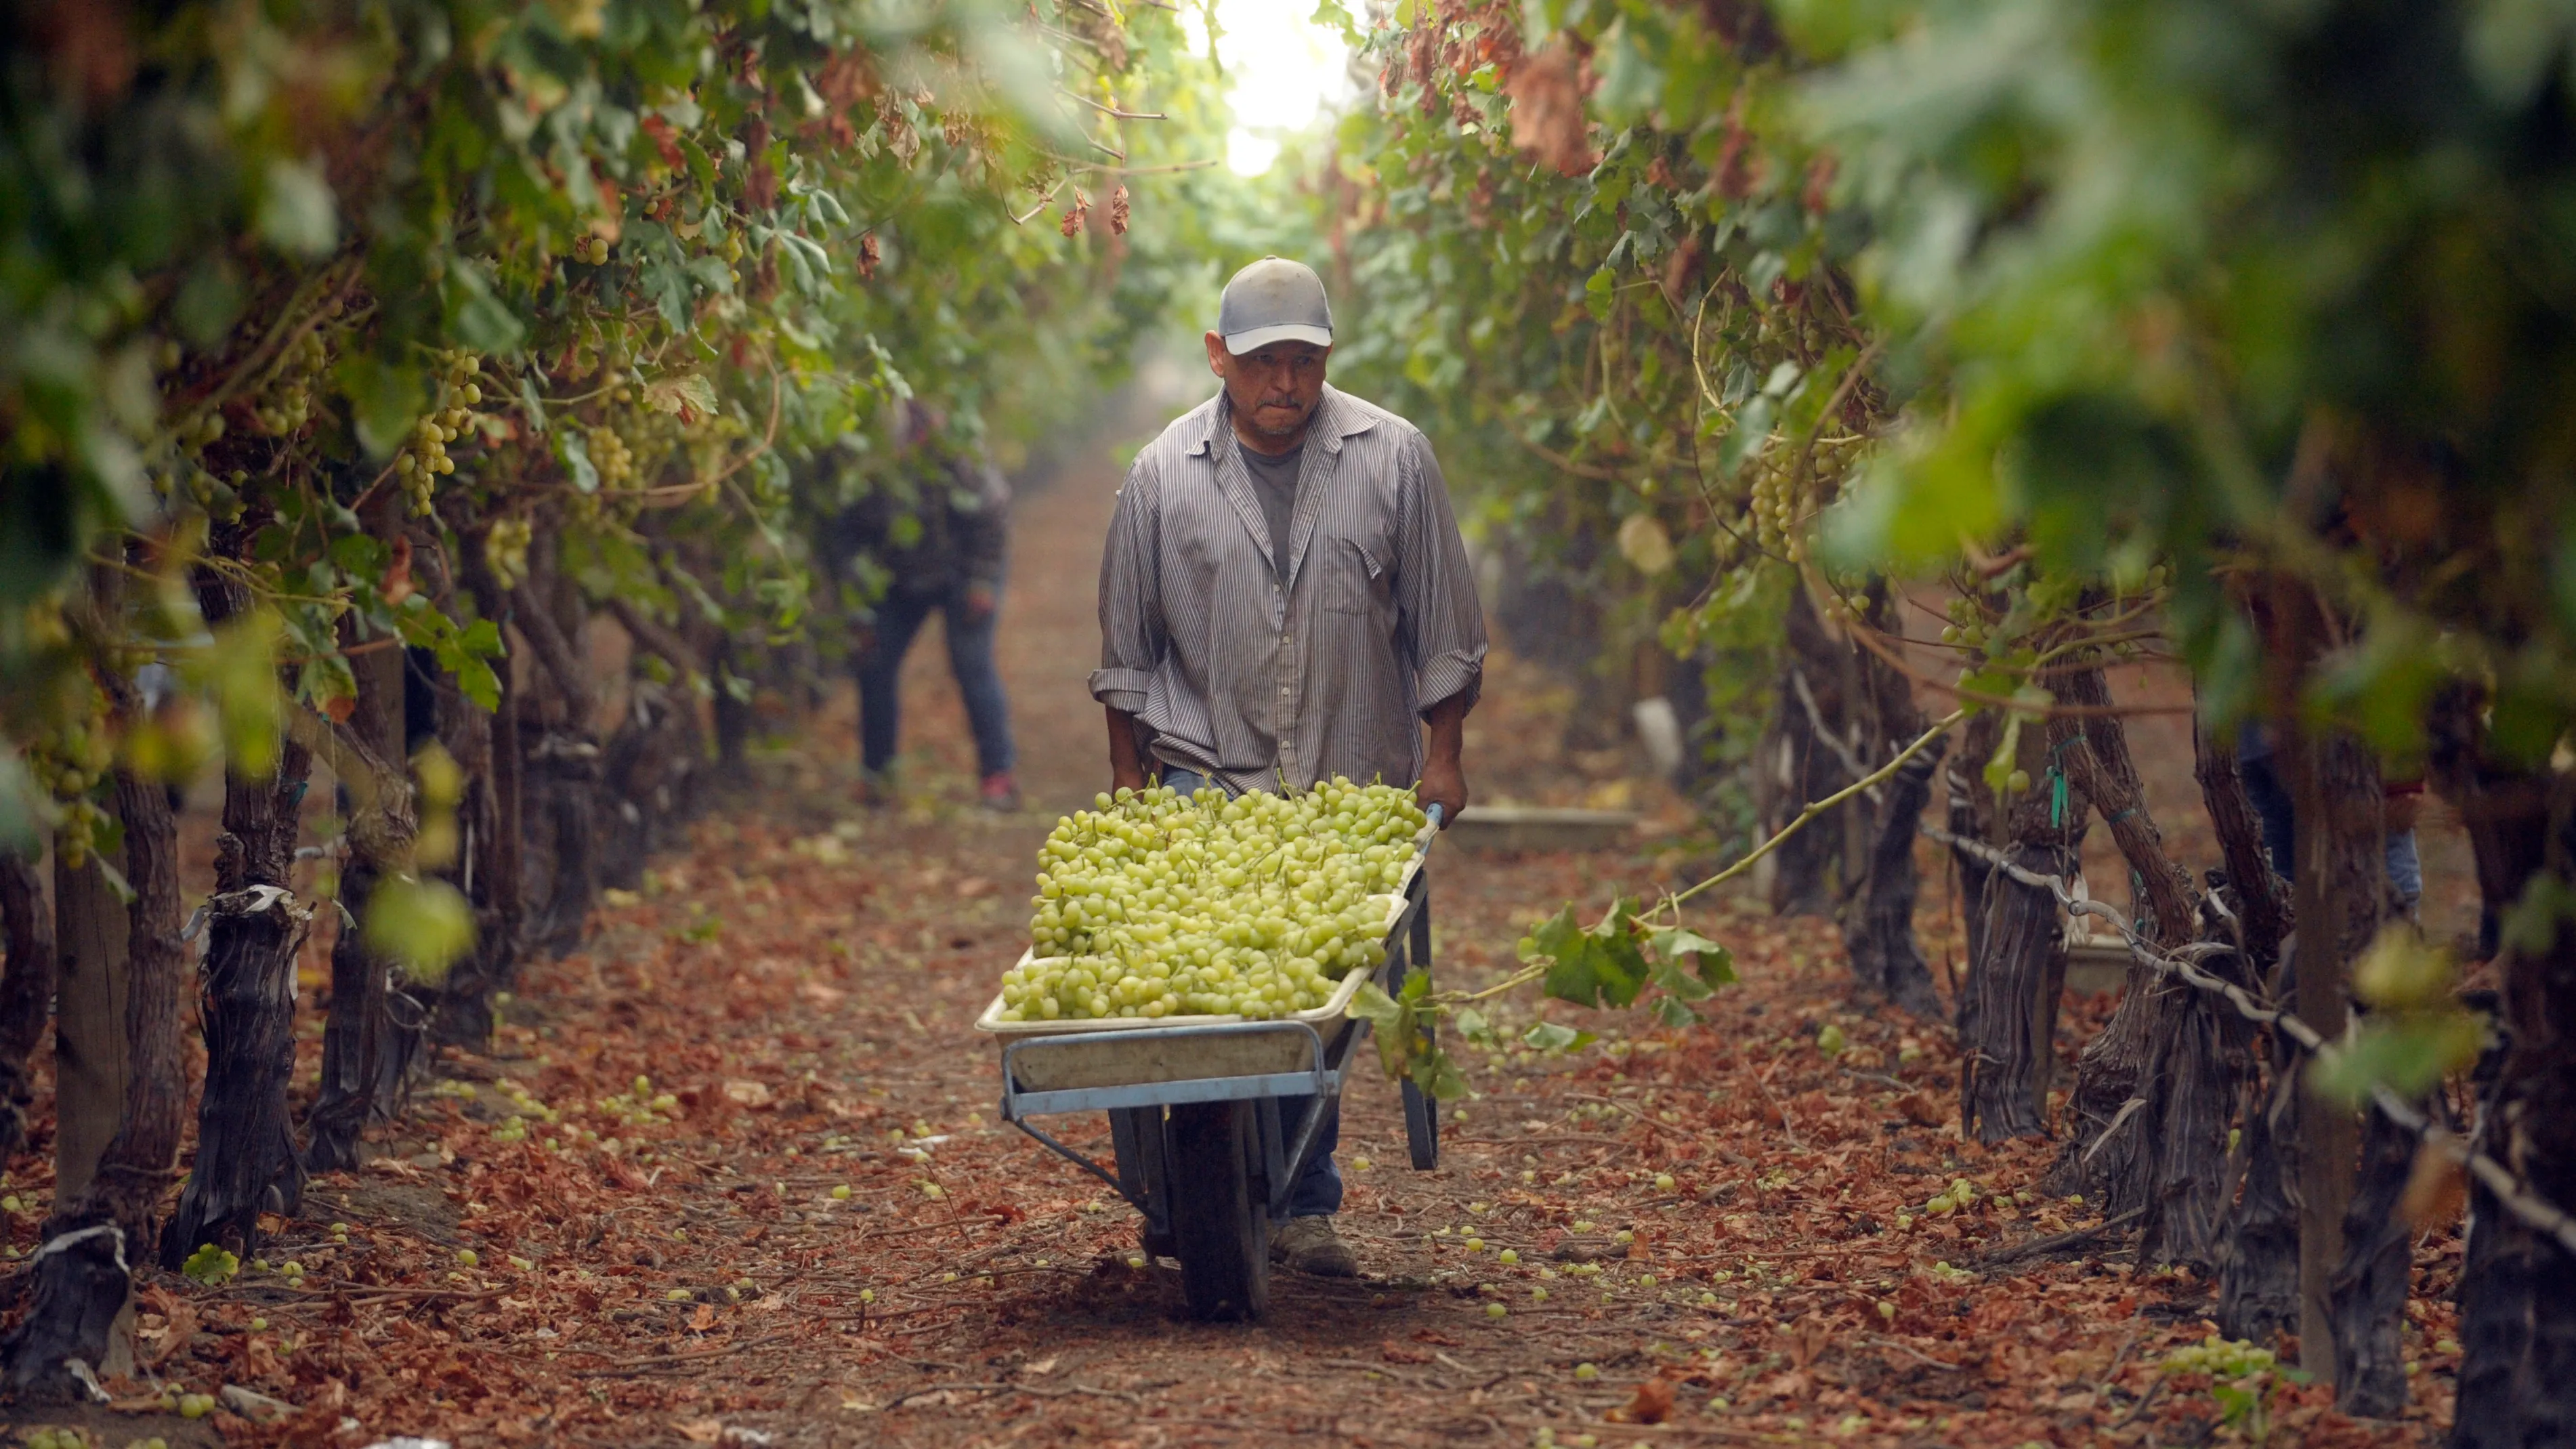
Developed an app that visualizes the relationship between irrigation demand, evapotranspiration-based irrigation intensity, and cropland changes across California’s Central Valley from 2008 to 2022. Users can interactively select drought and post-drought periods to compare irrigation patterns and crop loss or gain across four major agricultural regions: Central Valley, Sacramento, San Joaquin, and Tulare.
I incorporated remote sensing data from MODIS, CHIRPS, and the USDA Cropland Data Layer to estimate water needs and visualize temporal shifts in land use. Time series charts display trends in irrigation demand and intensity alongside crop loss percentages, helping users identify patterns linked to drought severity. This tool supports research and decision-making on climate-resilient agriculture and water resource management.
Engineered a data science and analytics pipeline, from EDA to developing time-series financial forecasting models using historical data from over 800+ healthcare facilities across the United States, to predict monthly financial changes and customer debt behavioral trends for United Health Services with less than 20% error.
Presented these findings to VPs and C-suites to inform strategic financial planning.
I led a team of fellow GIS students in developing a story map for LA2050, an initiative by the Goldhirsh Foundation aimed at empowering Los Angeles. Given LA’s urban landscape, our team identified optimal locations for new recreation parks where health-risked residents can have access to recreation parks.
I pulled various relevant data, such as census, parcel, park needs assessment, existing parks, poverty distribution, slope, landslide, fault line, and a few more to highlight areas in need using Raster Suitability Analysis. Zonal Statistics and 3D modeling were used to complete the visualization of demographic information and the park model.
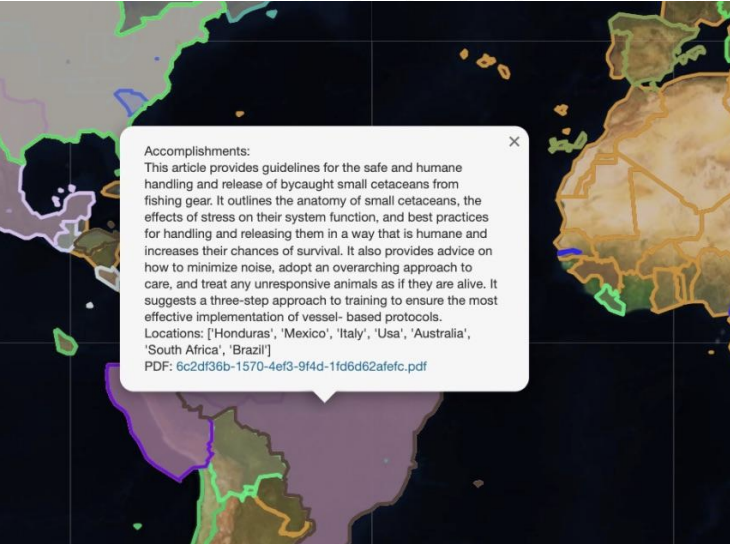
I led the GIS mapping portion for a comprehensive data analytics pipeline designed for the World Wildlife Fund (WWF) to showcase their global impact. We trained several large language models (LLM) to process over 200 PDF reports, extracting location-based insights using advanced Natural Language Processing (NLP) techniques before running a benchmark test to determine the best model for summarization.
Finally, I developed an interactive map interface that allows users to explore WWF’s global initiatives through detailed summaries, accomplishments, and geospatial visualizations. This tool enables users to analyze and understand WWF’s global contributions, and identify regions for potential future outreach.
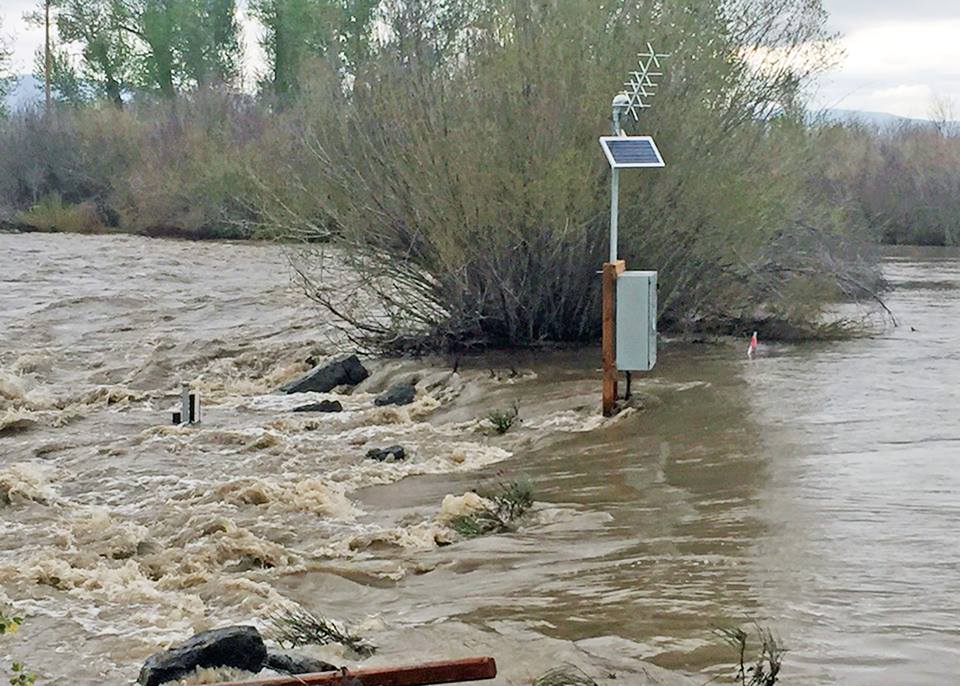
Developed StreamSage 2.0, an interactive dashboard powered by StreamLit which allows users to select n gages at any given day and observe streamflow behavior at different locations across California.
Under the hood, the model utilizes statistical methods such as similarity measure, weight assignments, and dynamic windowing to analyze streamflow data extracted from USGS to predict streamflow at locations with limited or no gage data at a low computation cost. The performances for both the previous and the current model are measured using Kling-Gupta efficiency (KGE) and R2. StreamSage 2.0 performed better than the previous model, achieving comparable results to TNC’s baseline model, Upstream.
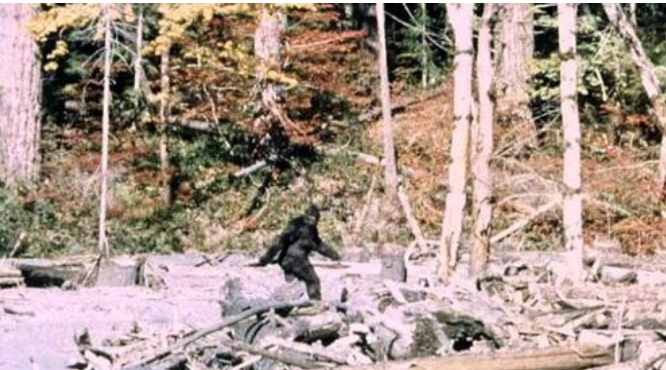
GIS Final project in which I utilized all the tools derived from labs, along with data from National Landcover Database + real-world datapoints on sitings dating back to 1950s to assess habitat suitability and movement patterns of Bigfoot.
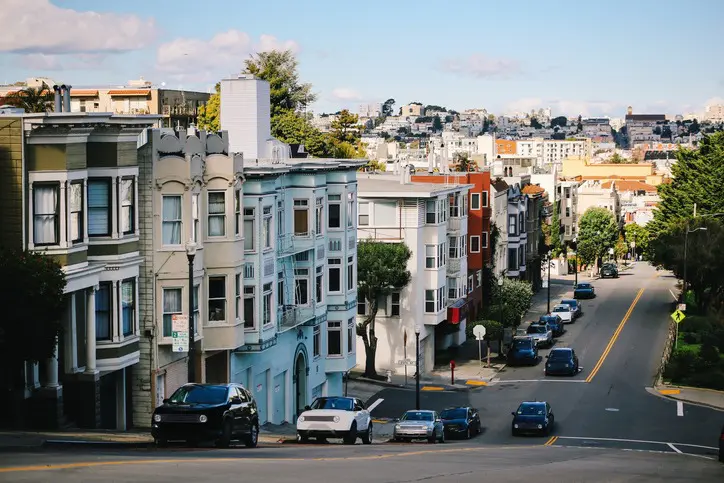
I used Network Analyst tools to calculate accessibility for Top SF Restaurants, Public Schools, and Fire Stations, and the Location-Allocation solver to identify best neighborhoods and optimal voter registration centers in SF. Service area polygons were generated using travel time as the impedance, and raster analysis was conducted to assess neighborhood accessibility.
The first map shows the best and worst neighborhoods in SF, and the other 15 Top SF Restaurants that could serve 68.7% of the target population (455,941 people), nearly reaching the 70% target.
GIS Lab work utilizing three spatial interpolation techniques: IDW, Spline, and Natural Neighbors. Click to read more.
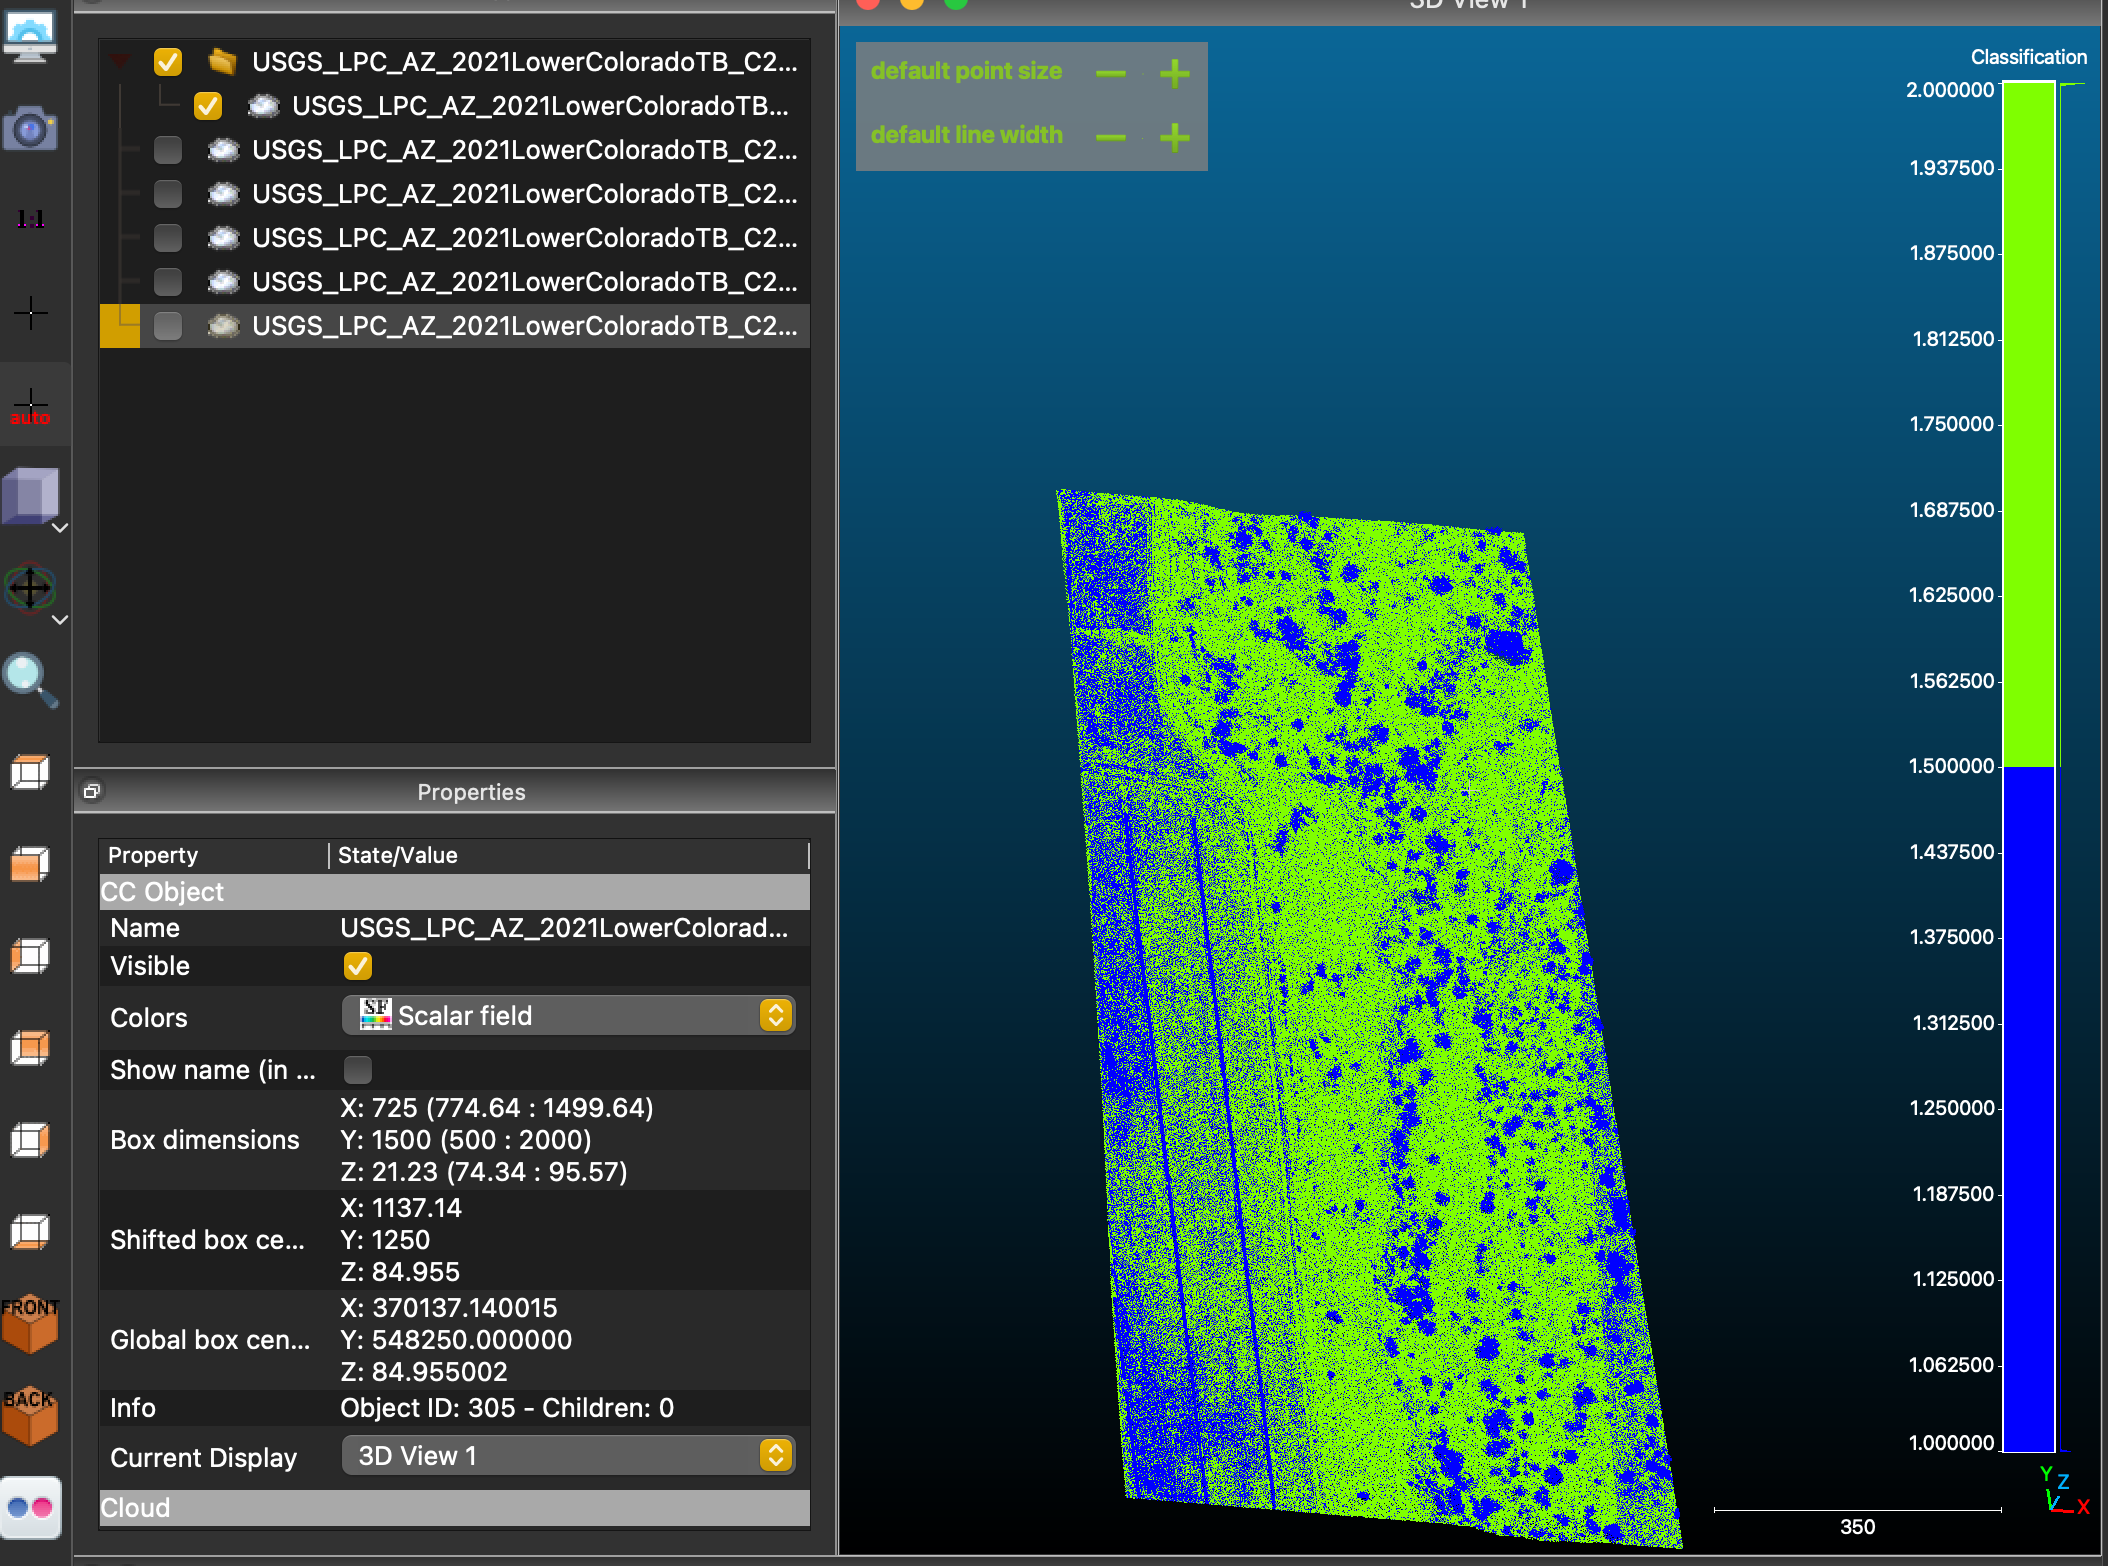
Developed a Digital Elevation Model (DEM) for the Lower Colorado River near Yuma, AZ by processing USGS LiDAR data in CloudCompare and isolating ground points. After rendering the terrain as a grayscale PNG, I manually georeferenced it in QGIS using landmarks from Google Earth Pro. This project demonstrates my ability to translate raw elevation data into actionable terrain models, supporting applications in flood risk assessment, habitat restoration, and infrastructure planning.
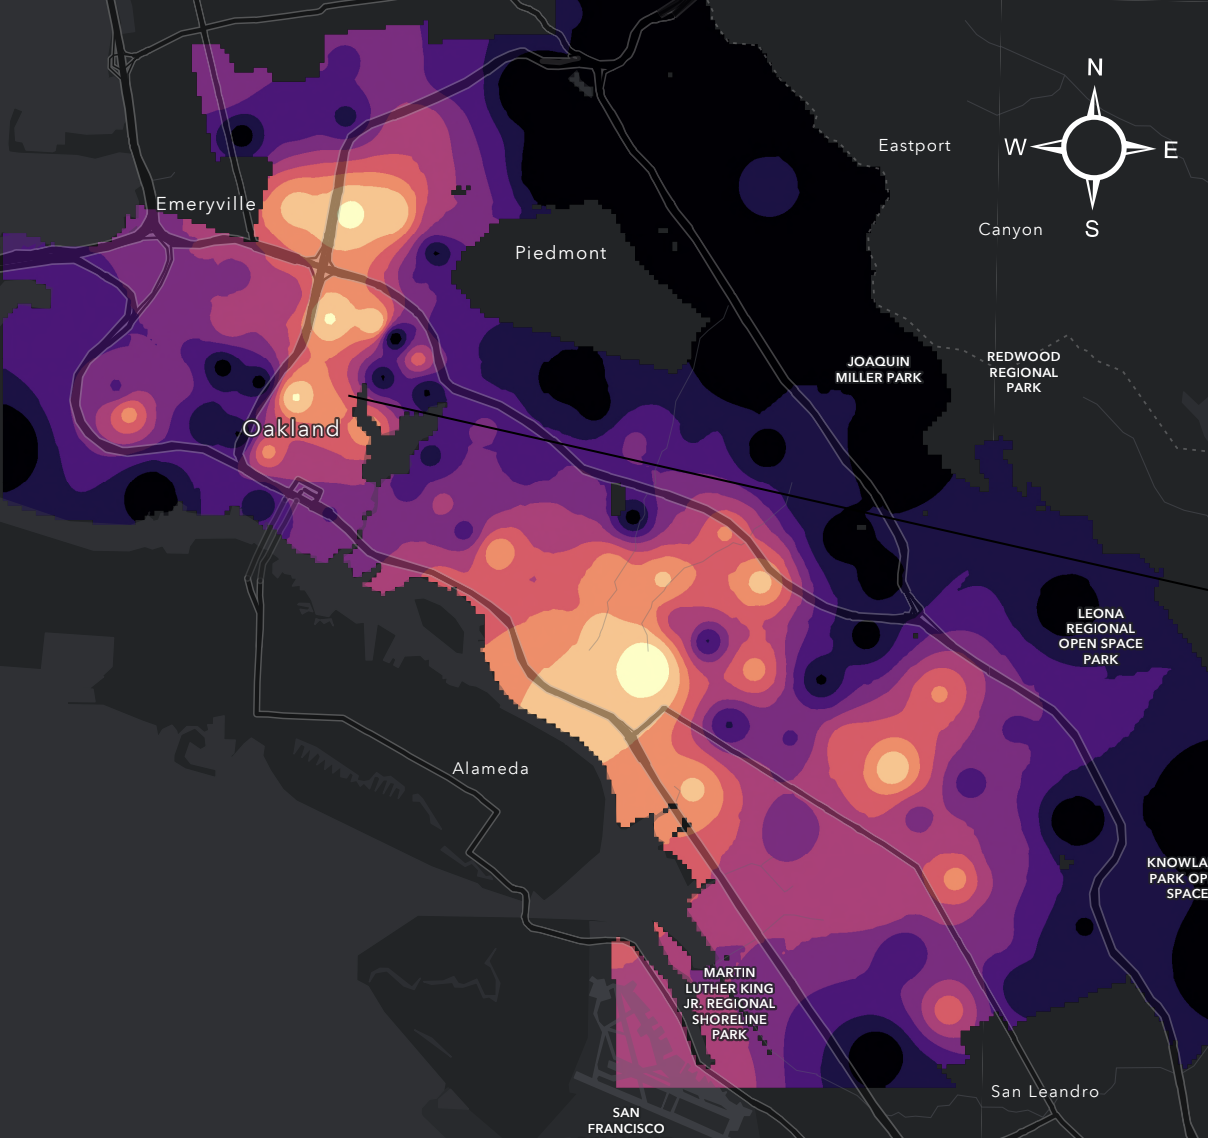
Identifying the visual correlation between demographic type (Black and White) and property value/ toxic site locations in Berkeley, CA. Using normalized population density for each group, I ran a statistical assessment on white population vs property value.
The map displays higher property values for neighborhoods with higher white population, while black population is higher in areas with more toxic sites.
GIS Lab work. Click to read more.
GIS Lab work. Click to read more.
GIS Lab work. Click to read more.
© 2025 Mark David Barranda